Demo 05: Algorithms01
This demo will demonstrate the options for plotting projections and images on TIGRE. The functions have been in previous demos, but in here an exaustive explanation and usage of them is given.
Define Geometry
import tigre
geo=tigre.geometry_default(high_quality=False)
Load data and generate projections
import numpy as np
from tigre.utilities.Ax import Ax
from tigre.demos.Test_data import data_loader
# define angles
angles=np.linspace(0,2*np.pi,dtype=np.float32)
# load head phantom data
head=data_loader.load_head_phantom(number_of_voxels=geo.nVoxel)
# generate projections
projections=Ax(head,geo,angles,'interpolated')
Usage of FDK
import tigre.algorithms as algs
print(help(algs.fdk))
Help on function FDK in module tigre.algorithms.single_pass_algorithms:

FDK(proj, geo, angles, **kwargs)
      solves CT image reconstruction.

      :param proj: np.array(dtype=float32),
       Data input in the form of 3d

      :param geo: tigre.utilities.geometry.Geometry
       Geometry of detector and image (see examples/Demo code)

      :param angles: np.array(dtype=float32)
       Angles of projection, shape = (nangles,3) or (nangles,)

      :param filter: str
       Type of filter used for backprojection
       opts: "shep_logan"
             "cosine"
             "hamming"
             "hann"

      :param verbose: bool
       Feedback print statements for algorithm progress

      :param kwargs: dict
       keyword arguments

      :return: np.array(dtype=float32)

      Usage:
      -------
      >>> import tigre
      >>> import tigre.algorithms as algs
      >>> import numpy
      >>> from tigre.demos.Test_data import data_loader
      >>> geo = tigre.geometry(mode='cone',default_geo=True,
      >>>                         nVoxel=np.array([64,64,64]))
      >>> angles = np.linspace(0,2*np.pi,100)
      >>> src_img = data_loader.load_head_phantom(geo.nVoxel)
      >>> proj = tigre.Ax(src_img,geo,angles)
      >>> output = algs.FDK(proj,geo,angles)

      tigre.demos.run() to launch ipython notebook file with examples.


      --------------------------------------------------------------------
      This file is part of the TIGRE Toolbox

      Copyright (c) 2015, University of Bath and
                          CERN-European Organization for Nuclear Research
                          All rights reserved.

      License:            Open Source under BSD.
                          See the full license at
                          https://github.com/CERN/TIGRE/license.txt

      Contact:            tigre.toolbox@gmail.com
      Codes:              https://github.com/CERN/TIGRE/
    ----------------------------------------------------------------------
      Coded by:          MATLAB (original code): Ander Biguri
                         PYTHON : Reuben Lindroos

None
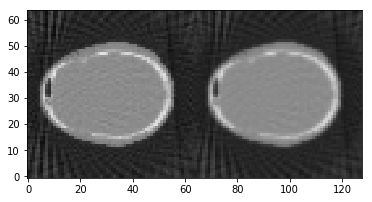
imgfdk1=algs.FDK(projections,geo,angles,filter='ram_lak')
imgfdk2=algs.FDK(projections,geo,angles,filter='hann')
# The look quite similar:
tigre.plotimg(np.hstack((imgfdk1,imgfdk2)),slice=32,dim='x')
<tigre.utilities.plotimg.plotimg instance at 0x7f740ab0a560>
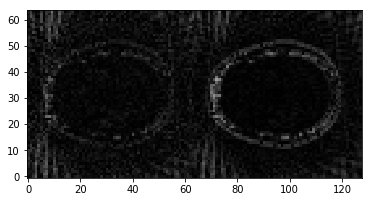
On the other hand it can be seen that one has bigger errors in the whole image while the other just in the boundaries
dif1=abs(head-imgfdk1)
dif2=abs(head-imgfdk2)
tigre.plotimg(np.hstack((dif1,dif2)),slice=32,dim='x')
<tigre.utilities.plotimg.plotimg instance at 0x7f7401a845a8>