Demo 04: How to use plotting functions
This demo will demonstrate the options for plotting projections and images on TIGRE. The functions have been in previous demos, but in here an exaustive explanation and usage of them is given.
Define Geometry
import tigre
geo=tigre.geometry_default(high_quality=False)
Load data and generate projections
import numpy as np
from tigre.utilities.Ax import Ax
from Test_data import data_loader
# define angles
angles=np.linspace(0,2*np.pi,dtype=np.float32)
# load head phantom data
head=data_loader.load_head_phantom(number_of_voxels=geo.nVoxel)
# generate projections
projections=Ax(head,geo,angles,'interpolated')
Reconstruct image using OS-SART and FDK
import tigre.algorithms as algs
from tigre.utilities.plotImg import plotImg

# OS_SART
niter=50
imgOSSART=algs.ossart(projections,geo,angles,niter)

# FDK
imgfdk=algs.fdk(projections,geo,angles)
OS_SART algorithm in progress.
Esitmated time until completetion (s): 2.46085
/home/aabhca20/Documents/TIGRE-python/Python/tigre_python_build/tigre/Utilities/filtering.py:56: UserWarning: no filter selected, using default ram_lak
  warnings.warn('no filter selected, using default ram_lak')
Let’s use plotproj
# plotproj plots the projection measured on the detector on each angle.
from tigre.utilities.plotproj import plotproj
plotproj(projections)
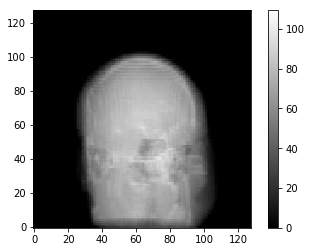
# another useful function is ppslice, which returns the projection at a single angle.
# Default is at projections[len(angles)/2]
from tigre.utilities.plotproj import ppslice
ppslice(projections,slice=35)
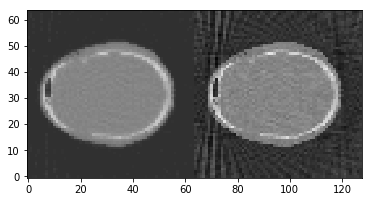
what about plotImg?
# plotImg plots the final reconstruction of the 3D array. Dim defaults to z, but can be
# changed accordingly
from tigre.utilities.plotImg import plotImg
# For more info on what parameters to use, type:
help(plotImg)
plotImg(np.hstack((imgOSSART,imgfdk)),slice=32)
Help on class plotImg in module tigre.Utilities.plotImg:

class plotImg
 |  plotImg(cube, dim)
 |      plots figure
 |  default: progressive in slices following
 |      axis (dim)
 |  Parameters
 |  ----------
 |  cube : Any 3D numpy array
 |
 |  dim : ("X","Y","Z","x","y","z"), optional
 |         default is "Z"
 |         NOTE: string arguments!
 |  slice: int, optional
 |       returns page of matrix according to index
 |  Examples:
 |  ---------
 |  a=np.ones([3,3,3])
 |  plotImg(a)
 |  >>>returns plot along dim Z
 |  plotImg(a,dim="X")
 |  >>>returns plot along dim X
 |
 |  Methods defined here:
 |
 |  __init__(self, cube, dim=None, slice=None)
 |
 |  run(self)
 |
 |  run_plot(self)
 |
 |  slicer(self)
<tigre.Utilities.plotImg.plotImg instance at 0x7f00e601ab48>